

The changes to the Disability Access Service began on May 20, 2024 at Walt Disney World and Disneyland Resort followed on June 18, 2024. Last week, we marked 120 days of the “New DAS” on the East Coast, and Walt Disney World Annual Passholders who had been part of the initial wave of approvals are reaching the end of their original 120-day approval and are reapplying. It’s time to take another look at the numbers and demographics we’ve learned from the database so far.
A new RTQ Database update will run tonight, so make sure you get your submissions in by 4:30 pm. The survey has had approximately 70 responses so far between the resorts, many with multiple parks included in a single response.
Before we get into the data, I wanted to share some changes we’ve seen so far:
- The institution of a 120-day ban on re-applying after two denials. When the DAS changes first went into effect, a common piece of advice disabled guests were receiving from peers and cast members was to “keep trying,” leading to some people chatting several times. In early August, users in DAS-related Facebook groups were sharing that they were being told that Cast Members were unable to assist them until early December. Though not mentioned on the official parks’ websites, this policy has been confirmed to be a 120-day temporary DAS registration ban from the date of the second denial.
- A new approval window for some guests with DAS. On the night of September 19, reports started coming in about a revised approval window of 240 days for Annual Passholders and Disney Vacation Club members at Walt Disney World. As of today, some Disneyland Magic Key holders are reporting the same window. This new window is not reflected on the official websites, and there is some concern over what all this 240 days will be applied to, so in an attempt to gather information, I set up a survey to look specifically at the new approval windows and how they’re being applied. So far, I’ve got reports from several WDW AP holders that the 240 window is what they’re getting, as of at least 9/17 (I have no data from 9/14-9/16, but prior to that was definitely 120 days). One military ticket holder heading to Disneyland reported being approved for the specific window that their ticket is valid. That said, we need more data – there have been no responses from DVC owners without APs, Magic Key Holders, Cast Members, military ticket holders at the Florida parks… If you’ve been approved for the Disability Access Service and want to help with the information collection about this, please fill out the survey here. I’m also trying to gather information about whether this 240-day period is being applied to the aforementioned registration ban – if you’ve been told that you are unable to reapply for a specific period of time since 9/14/2024, please fill out the General Contribution Form and let me know the date you were denied and when you were told you could try again.
Now onto what trends we’re seeing among survey respondents…
(Note on limitations: This is a very small data set compared to the number of guests who visit the parks and apply for accommodations each day. The more responses, the clearer the picture becomes. There are some very interesting trends, especially when comparing East Coast vs. West Coast, however East Coast has double the number of responses. This is also all self-reported anonymous information, and with that I can’t guarantee accuracy of any statements made by any survey respondents. The RTQ database is not a survey that considers DAS approval rates, as it only applies to disabled park visitors who either were 1) denied DAS or 2) did not apply for DAS after hearing about the denials and who visited AFTER the changes began at their respective parks. DAS-Related information shared should not be considered a “full picture” of what’s going on with the DAS calls, because it does have a bias – we have no information about who was approved (and the approval window survey doesn’t ask the same kinds of questions due to the scope of that survey). This was done intentionally, because I’ve always held the view on my blog that sharing information to “help you get approved” for DAS contributes to the problems guests are facing with the restrictions. None of the information shared below this paragraph is indicative of any opinions I personally hold, and none of this page is related to any experiences I personally have had with the parks or the company overall, with two exceptions. The only exceptions are things I’ve shared italicized in parentheses with the preface of “Speculatory Note,” which are predictions or speculation around trends I believe we may see in the future, or “Personal Note,” which give my thoughts on data or discrepancies shared in that section of the post.)
Park Popularity
On the East Coast, Magic Kingdom is the park respondents are going to the most (72.3% of respondents), followed by EPCOT (70.2%), Disney’s Hollywood Studios (61.7%), and finally Disney’s Animal Kingdom (48.9%). (Speculatory Note: I expect the numbers for Disney’s Animal Kingdom to pick up briefly as we gear up for the Dinoland, U.S.A. overhaul, die down again as construction is going on, and then surge when the Tropical Americas area opens.)
On the West Coast, Disneyland is the favorite among respondents (90.5%), and Disney California Adventure comes in at 61.9%
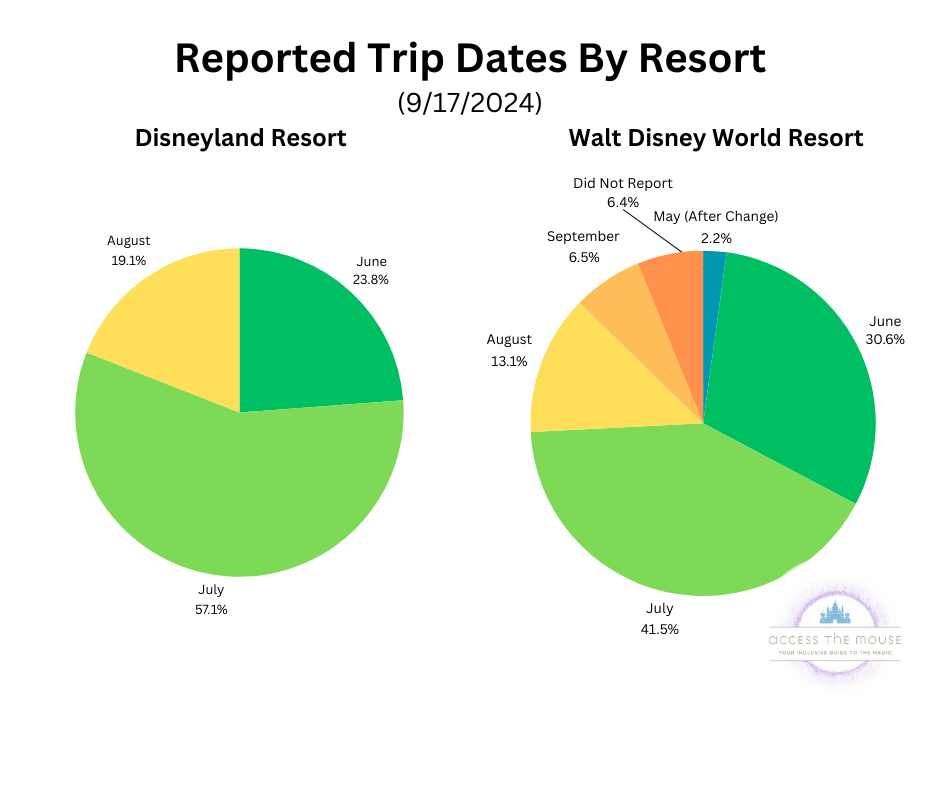
Visit Dates
To better understand the make up of the survey responses it is important to note when the visits being discussed have occurred. 19.1% of the “West Coast” survey visits occurred in August, 57.1% in July, while 23.8% were in June. West Coast has no reported dates for September trip. On the East Coast, 2.2% of respondents indicated that they visited the resort in May, after the changes occurred, 30.6% in June, 41.5% in July, 13.1% in August, and 6.5% in September. Reporting has slowed down, skewing the data toward earlier experience – if you’ve been to the parks in August and September, please consider sharing your experience to the anonymous survey, which can be found here.
DAS-Related Trends
One question on the surveys asks “Have you previously held a DAS pass or a Guest Assistance Card (GAC), and for how long?”
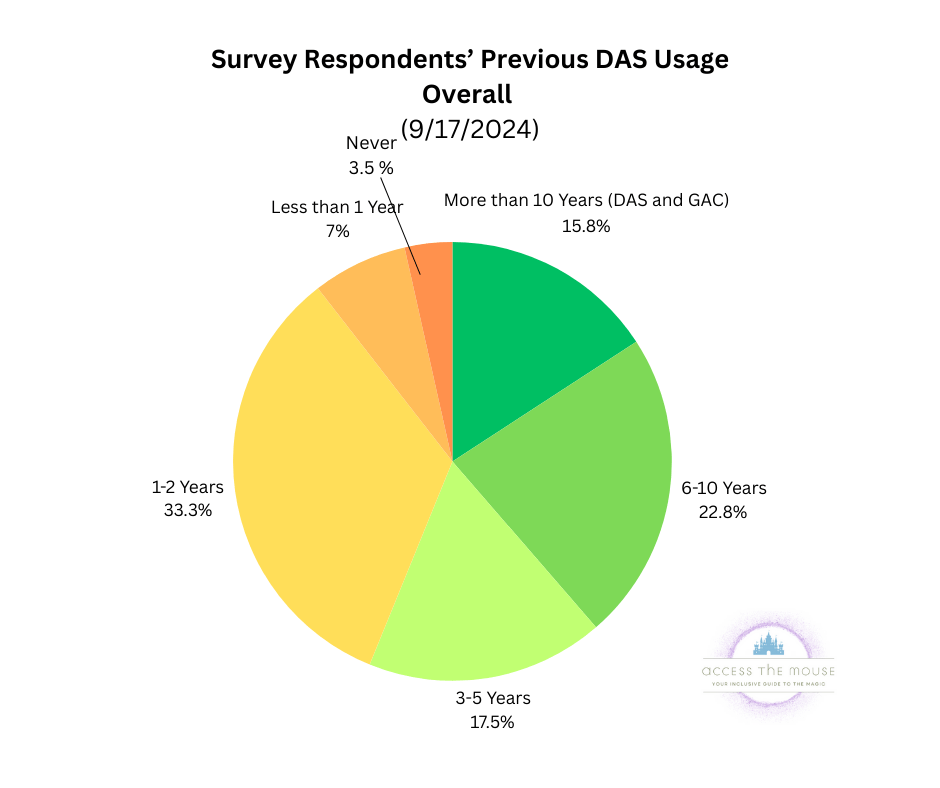
Between both resorts, an average of approximately 39% of survey respondents indicated that they have been DAS holders for 6 or more years, with approximately 16% having used both DAS and the previous GAC system. Users indicating that they have been DAS holders for 3-5 years average approximately 18% between resorts, and users indicating that they have been DAS holders for 2 years or less make up approximately 44% of respondents. 3.5% of survey respondents indicated that they have never been a DAS holder.
Changes from previous data on 8/1/24: “More than 10 Years (DAS and GAC)” has increased from 11.1% on August 1, to 15.8% on September 17. “6-10 Years” has decreased from 25% to 22.8%. “3-5 Years” has increased from 13.9% to 17.5%. “1-2 Years” has decreased from 36.1% to 33.3%. “Less than 1 Year” decreased from 8.3% to 7%. “Never” decreased from 5.6% to 3.5%.
Interpretation: We’re seeing more responses overall in August and September from previous longtime DAS-holders, and fewer from people who just started using the system in the last five years.
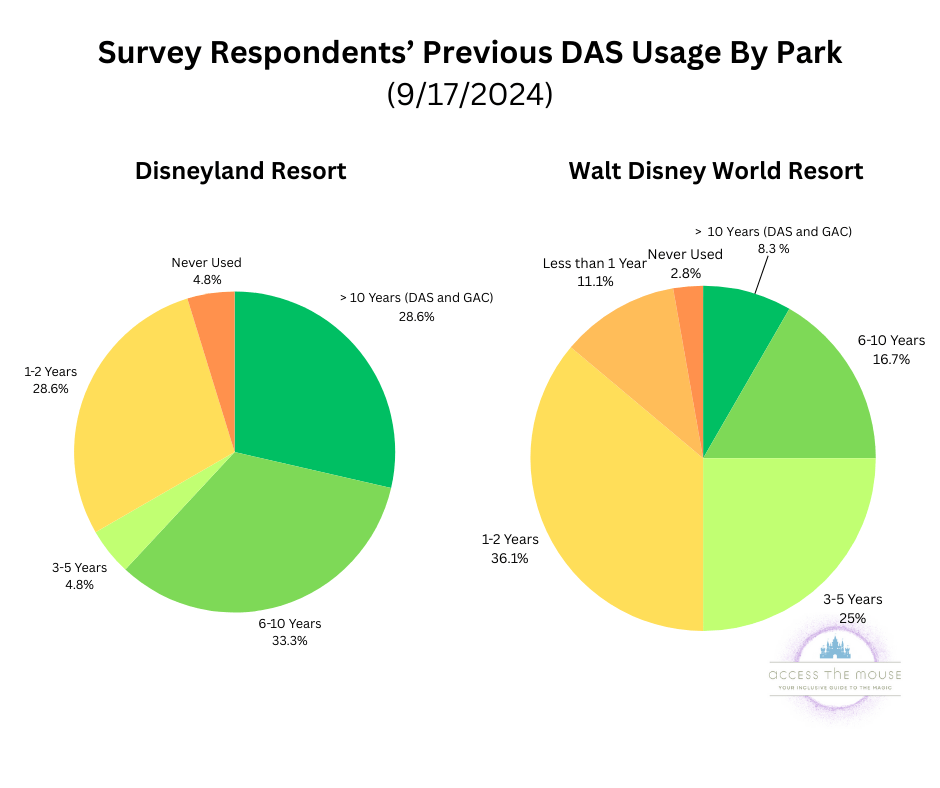
When you break this down by resort, 62% of Disneyland Resort respondents indicated that they have been DAS holders for 6 or more years, with approximately 29% having used disability services at the parks for more than 10 years. West Coast Users indicating that they have been DAS holders for 3-5 years average approximately 4.8% at Disneyland Resort, and users indicating that they have been DAS holders for 2 years or less make up approximately 29% of respondents, and approximately 5% indicated that they have never been a DAS holder.
At Walt Disney World Resort, only about 25% of respondents indicated that they have been DAS holders for 6 or more years, with approximately 8% having used disability services at the parks for more than 10 years. Users indicating that they have been DAS holders for 3-5 years are another 25% at Walt Disney World Resort, and users indicating that they have been DAS holders for 2 years or less make up approximately 47% of respondents. 3% of survey respondents indicated that they have never been a DAS holder.
(Personal Note: Last month I said that the breakdown between parks was really intriguing. I stand by that. The numbers have shifted some overall, but when you look at this data, it’s not super different than the previous iteration. As I had said before, “If this data is to be taken at “face value” nearly 2/3 of respondents on the West Coast have been using disability services for 6 or more years, while over 3/4 of respondents on the East Coast have either been using disability services for 5 years or less (or have never used disability services at all). I think this ties into what we’re seeing about the rise in usage, which Disney has described as “misuse,” but it also strongly correlates with COVID-19. I’d be interested to see a year-by-year breakdown on this data, if it were available.”)
Recommended “Alternate Accommodations”
One question on the survey asks “If you did apply, what “alternate accommodations” were recommended to you by the DAS registration team after your denial?” and allows respondents to select from several options and to record their own responses.
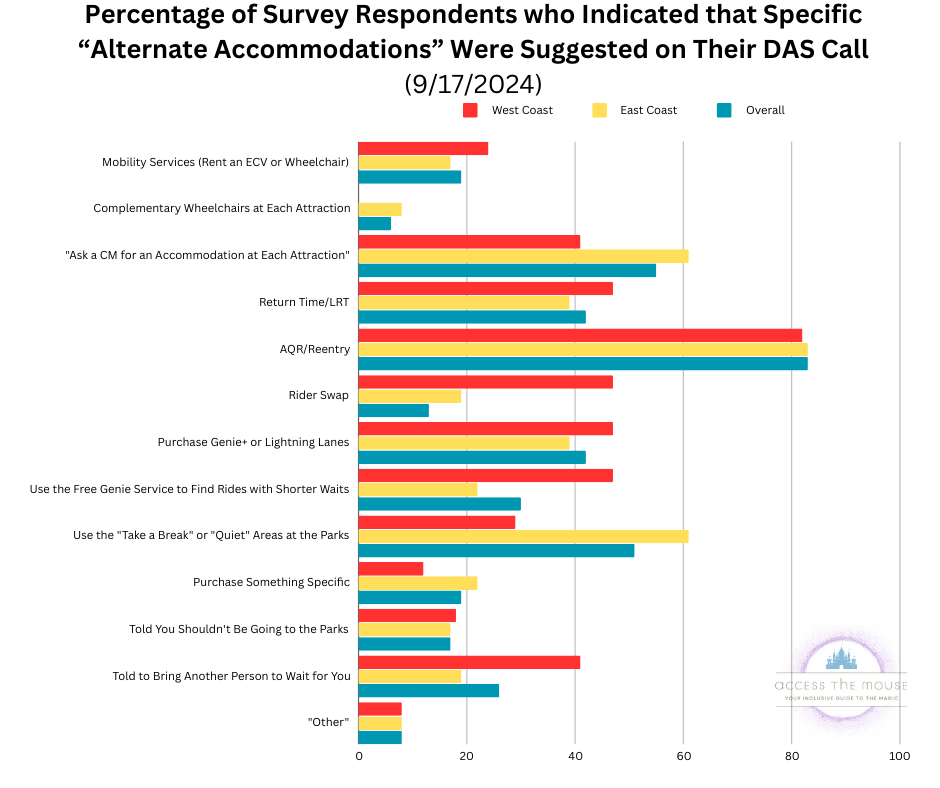
Most survey respondents who attempted to apply for DAS across parks indicated that they were recommended to utilize the “Attraction Queue Re-entry” program (83% overall, 82% West Coast, 83% East Coast).
Respondents indicated that most of the other “alternate accommodations” recommendations were very park-dependent. West Coast still has no reported recommendations to utilize complementary wheelchairs at attractions, and continues to have a higher recommendation rate for utilizing Rider Swap (47% West Coast, 19% East Coast), bringing another person to wait in lines for you (41% West Coast, 19% East Coast), ECV or wheelchair rentals (24% West Coast, 17% East Coast), and using the free “Genie” service to find rides with shorter waits (47% West Coast, 22% East Coast). Location Return Times and Purchasing Genie+ or Lightning Lane were also a common recommendation with 47% of respondents on the West Coast indicating this was recommended to them.
On the East Coast, a majority of respondents still indicated that they were told to use the “Take a Break” or “Quiet” areas at the parks (61% East Coast, 29% West Coast) and to “Ask a CM for an Accommodation at Each Attraction” (61% East Coast, 29% West Coast), and recommendations to “purchase something specific” that did not include Genie+ or Lightning Lanes. (22% East Coast, 12% West Coast)
Across Coasts, “Purchase Recommendations” from the DAS Team included
- 3 respondents indicating ear defenders, noise cancelling headphones, or ear plugs
- 2 respondents indicating fidget toys
- Others indicated fans, adult diapers, cooling towels, stress balls, a mobility scooter, and extra batteries for expensive medical equipment.
Changes from previous data on 8/1/24:
Since this data is an overall look at all reports since the changes took place, I wanted to run a comparison against percentages reported on the August 1 data. I omitted the “overall” (teal) category from the previous graph, because this section is comparing the change at specific parks.

The West Coast data is represented by two red bars at the top of each set of bars.
East Coast Data is represented by two gold bars at the bottom of each set of bars.
Labels down the left side indicate specific recommendations, such as mobility services or asking for an accommodation at each attraction. The slightly darker, second bar of each group bars represent current data, while the lighter version shows data that was current on 8/1/2024, showing increased and decreased frequency of specific recommendations.
What’s changed? The comparison shows small increases in recommendations for mobility services across the board, and while there continue to be no recommendations for complementary attraction wheelchairs for the lines at the California parks, it’s doubled as a recommendation at the Florida parks, though it is still overwhelmingly the least recommended accommodation there.
Most of the graph is full of small increases or decreases over time (“Attraction Queue Re-entry” is slightly down on both coasts from 8/1, and “Told to Bring Another Person to Wait for You” is the opposite, with both recommending it more often.
“Ask a CM for an Accommodation at each Attraction” is up at both resorts, but much more dramatically at Disneyland, and recommendations to use the “Take a Break” and “Quiet” areas is down at both, but in a major way on the East Coast (in early August, this was tied for the most-recommended accommodation at Walt Disney World with AQR. It seems to have dropped by around 1/4.
Other significant changes were accommodations that got more recommendations over time on one coast and fewer on the other.
- Return Time/LRT went up at Disneyland, but down at Walt Disney World
- Rider Swap went up slightly at Disneyland, but down by close to 1/3 at Walt Disney World.
- Recommendations to purchase Lightning Lane increased slightly for Disneyland, but dropped at Walt Disney World.
- Recommendations to use the Free Genie Service to “plan better” (as two respondents indicated they were told) was up a lot at Disneyland, but down at Walt Disney World.
- “Purchase Something Specific” (such as ear defenders and fidget toys) went up at Disneyland and down at Walt Disney World.
- Reports of being told that you “shouldn’t be coming to the parks” also slightly increased at Disneyland and dropped at Walt Disney World.
(Personal Note: This is really interesting to me, especially when paired with other differences between resorts (like the 41 attractions at Walt Disney World meeting the criteria for the “‘Best Bets’ for Disabled Guests” post yesterday, compared to the 6 at Disneyland resort, and the info about how long people had held DAS previously to the changes, above). I’m definitely looking more into these differences. Aside from that, I just feel the need to point out how huge that drop in the recommendations to use the “Take a Break” area is. I’ve spoken with several other disabled Disney-goers who’ve echoed that in addition to the areas being recommended not being ideal for their needs, they aren’t even labelled in the parks.)
Disability-Related Questions
Another question on the survey asks “What is the nature of your disability?” and allows respondents to select from several options and to record their own responses. This does not correspond with whether the user had applied for DAS, but does speak to what kinds of concerns respondents had, which would be reflected in the data.

The vast majority of survey respondents accessing the parks without DAS (73% overall) identified that they had an anxiety or trauma-related disability, including but not limited to Panic Disorder or Post Traumatic Stress Disorder.
The next-highest response overall was disabilities impacting the neurological, endocrine, and/or cardiac systems (51% Overall, 67% of West Coast, 43% of East Coast), followed by the “other” response.
East Coast respondents still had a notably higher percentage for “gastrointestinal disorders” (38%) compared to the West Coast (29%), whereas West Coast had higher indications for “other developmental disorders” (33% West Coast, 17% East Coast) and “other psychiatric conditions” (14% West Coast, 7% East Coast). The percentage of guests reporting “autism” was equal across parks (14% on both coasts)
Other reported disabilities include
- 5 respondents indicating “spinal issues” of some form
- 3 respondents indicating “immune system” related concerns, including autoimmune diseases and immunocompromised status
- 2 respondents each indicating migraine, Ehlers-Danlos Syndrome, Mast Cell Activation Syndrome, Postural Orthostatic Tachycardia Syndrome, Cancer, and Lupus
- Various other responses, including but not limited to, adrenal issue, kidney disease, heat intolerance, crowd intolerance, pain, dysautonomia, Type I Diabetes, people on the transplant list, Deaf/HOH, low vision, TBI, genetic disorders, and anaphylactic food allergies with airborne sensitivity.
A follow-up questions asks “What aspects of your disability make long standby queueing unsafe or impossible?” and allows respondents to select from several options and to record their own responses. Again, this does not correspond with whether the user had applied for DAS, but does speak to what kinds of concerns respondents had, which would be reflected in the data.
Changes from previous data on 8/1/24: “Anxiety or Trauma – West Coast” has decreased from 81% on August 1, to 76% on September 17. “Anxiety or Trauma – East Coast” has decreased from 80% on August 1, to 71% on September 17. “Anxiety or Trauma – Overall” has decreased from 80% on August 1, to 73% on September 17.
“Neurological, Endocrine, and/or Cardiac Systems – West Coast” has increased from 56% on August 1, to 67% on September 17. “Neurological, Endocrine, and/or Cardiac Systems – East Coast” has remained the same at 43%. “Neurological, Endocrine, and/or Cardiac Systems – Overall” has increased from 48% on August 1, to 51% on September 17.
“Gastrointestinal Disorders – West Coast” has increased from 19% on August 1, to 29% on September 17. “Gastrointestinal Disorders – East Coast” has decreased from 47% on August 1, to 38% on September 17. “Gastrointestinal Disorders – Overall” has decreased from 37% on August 1, to 35% on September 17.
“Autism, specifically – West Coast” has decreased from 19% on August 1, to 14% on September 17. “Autism, specifically – East Coast” has increased from 13% on August 1, to 14% on September 17. “Autism, specifically – Overall” has increased from 15% on August 1, to 14% on September 17.
“Other Developmental Disorders – West Coast” has increased from 31% on August 1, to 33% on September 17. “Other Developmental Disorders – East Coast” has decreased from 20% on August 1, to 17% on September 17. “Other Developmental Disorders – Overall” has decreased from 24% on August 1, to 22% on September 17.
“Other Psychiatric Conditions – West Coast” has increased from 13% on August 1, to 14% on September 17. “Other Psychiatric Conditions – East Coast” has increased from 10% on August 1, to 7% on September 17. “Other Psychiatric Conditions – Overall” has increased from 11% on August 1, to 10% on September 17.
Selection of the “Other” category for West Coast respondents increased from 44% on August 1, to 48% on September 17. For East Coast respondents, it went from from 40% on August 1, to 38% on September 17. And overall, the change went from from 41% on August 1, to 41% on September 17.
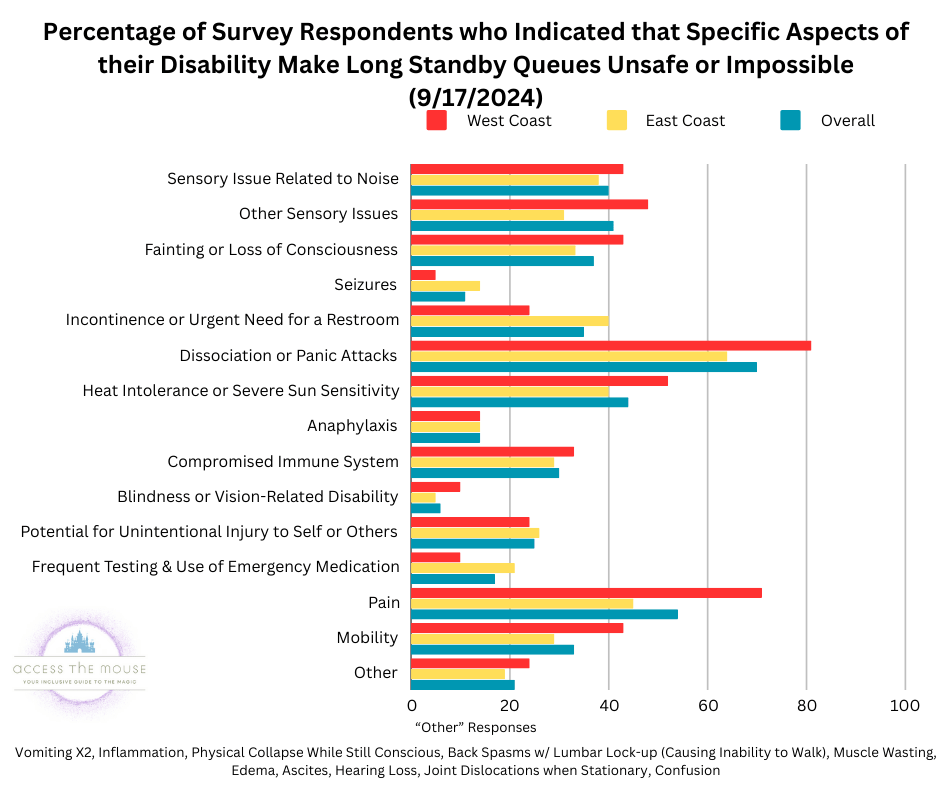
Bar Graph of the percentage of survey respondents who identified that specific aspects of their disabilities make long standby queues unsafe or impossible, represented by colored horizontal bars in groups of three. The West Coast data is represented by red bars at the top of each set of bars. East Coast Data is represented by gold bars in the middle of each set of bars. Combined Data is represented by teal bars at the bottom of each set of bars. Labels down the left side indicate specific disabilities, such as anxiety or trauma, autism, gastrointestinal disorders, or neurological, endocrine, and/or cardiac systems. Under the graph is a list of responses that were submitted under “other”.
For this question, the highest responses overall were “dissociation or panic attacks” (70% of respondents), “pain” (54%), “heat intolerance or severe sun sensitivity” (44%), and “other sensory issues” (meaning sensory issues other than those related to noise) (41%).
Notably, East Coast had a dramatically higher number of respondents indicating a seizure disorder (14% East Coast, 5% West Coast), and “incontinence or urgent need for a restroom” (40% East Coast, 24% West Coast). West Coast had a higher number of respondents indicating “other sensory issues” (meaning sensory issues other than those related to noise) (48% West Coast, 31% East Coast), “fainting or loss of consciousness” (43% West Coast, 33% East Coast), “dissociation or panic attacks” (81% West Coast, 64% East Coast), “heat intolerance or severe sun sensitivity” (52% West Coast, 40% East Coast), “pain” (71% West Coast, 45% East Coast), and “mobility” (43% West Coast, 29% East Coast)
21% of survey respondents overall selected “other.” These responses include:
- 2 respondents indicating vomiting
- 1 respondent indicating “physical collapse while still conscious”
- other responses include, but are not limited to, confusion, edema, hearing loss, joint locations when stationary, and severe back spasms.
Comparisons of Rides and Time Spent Before and After DAS Changes
One section toward the end of the surveys asks users to compare the number of rides they were able to go on and the number of hours spent at the parks on an average day before the DAS changes to the visit they were discussing in the survey.

For the number of rides, 86% of respondents indicated that before the DAS changes, they were able to ride four or more rides in an average day, with 36% indicating ten or more rides. 12% indicated that the were able to ride an average of 3 rides in an average day before the changes took place, and no guests indicated riding an average of less than 3 rides in an average day.
As of 8/1/2024, the number of respondents who indicated that they were able to ride four or more rides on this visit had dropped to 38%, with just 2% indicating ten or more rides. 17% indicated that the were able to ride an average of 3 rides per day on their current visit, and 32% indicated that they were only able to ride 1-2 rides per day. 13% of respondents indicated “I wasn’t able to experience any rides I had hoped to.”
The current data shows a shift. While only 2% are still indicating that they had ridden 10 or more rides, there was a slight increase in the “8-9” rides category up to 6%. The number of users indicating that they were able to ride at least 4 rides has risen to 46% (from that 38% at the beginning of August). The biggest increase was the “4-5 rides” category, which rose from 23% on 8/1/24 to 29% on September 17. The “3 rides” category went up by one percentage point to 18% and the number of respondents indicating that they’d only made it on 1-2 rides per day dropped from 32% on 8/1/24 to 27% on 9/17/24. The number of respondents who indicated “I wasn’t able to experience any rides I had hoped to” had the most significant decrease, dropping 4 percentage points to 9% on 9/17/24. It’s clearly much lower than pre-change numbers, but worth noting that it has shifted some.
There’s an observable shift when it comes to hours spent in the parks, too.

87% of respondents indicated that before the DAS changes, they were able to spend 6 or more hours in the parks, with the highest indication being a tie for 6-7 hours and 10+ hours on an average day (33% each).
On 8/1/24, the number of respondents who indicated that they were able to spend 6 or more hours in the parks had dropped to 24%. 32% of respondents indicated that the averaged 4-5 hours a day on their most recent visit, while 45% only managed to spend 3 hours or less in the parks each day.
As of 9/17/24, this information has shifted as well. Though it’s still nowhere near the original numbers, indications for all categories of 5 hours or less have decreased, while those for 6-9 hours have increased. 10+ hours has held steady at 9% since August. If we compare it to the 8/1/24 data in the previous paragraph, the number of respondents who indicated that they were able to spend 6 or more hours in the parks has increased to 33% (from 24% on 8/1). 29% of respondents indicated that the averaged 4-5 hours a day on their most recent visit, and 37% only managed to spend 3 hours or less in the parks each day.
(Personal Note: So… let’s talk about these shifts. In the last month and a half, people are indicating more time spent in the parks AND more rides on an average day than in May/June/July. However, they are still way lower than “baseline” numbers from before the changes. There’s no clearcut way to know what’s contributing to these changes since 8/1/24 – are Cast Members offering more accommodations than before? Look to the RTQ Database for that. Are wait times down in general? Are people pushing themselves past their limits to not “waste” a vacation day? We don’t know. While the numbers do lead me to feel slightly optimistic, we need to be realistic about what we’re seeing. I’d like to see a more dramatic shift to the left side of these charts – indicating more rides and more time in park, similar to what we were seeing before the changes. I’d also love to have data to compare this to for able-bodied park-goers. I still firmly hold the belief that disabled guests should be able to experience a comparable amount of attractions to able-bodied guests.)
Other Reports
Disneyland Resort had no accessibility problems reported in the “West Coast” survey for any of the Disneyland Resort hotels, transportation, or special events. One issue was reported at the Downtown Disney District, where one guest indicated that the Lego store was “too crowded”.
At Walt Disney World Resort, no accessibility problems were reported in the “East Coast” survey for Mini Golf locations, or Special Events. Other on-site issues include:
- One respondent indicated that they had requested an accessible room at their deluxe-level Disney resort hotel and were not given an accessible room, which led to problems with completing personal hygiene tasks for a party member.
- Disney Springs: noise and heavy crowds, especially on weekends, inaccessible doors, and people blocking mobility devices after the drone shows.
- Typhoon Lagoon: there are no accommodations at the Disney Water Parks, so guests were dealing with long lines, no return times, and one person indicated that the larger rafts are hard to carry. One user indicated that the posted wait times were incorrect, which made determining whether or not a line was manageable for their disabled child. That user stated that in one case, a ride with a posted “5 minute” wait time ended up taking an hour, and another that was posted as “45 minutes” took less than 5 minutes.
- Transportation: 13% of survey-takers did not respond to the question about whether they faced issues on transportation. Another 30% indicated that they did not use resort transportation. Of those who did, 2/3 said there were no issues, and 1/3 indicated problems with crowded buses (one response indicated that the crowd was so heavy the user had to exit the bus), the monorail ramps being too steep, and issues with other people. One responded noted that they ran into major delays trying to get from Disney Springs to one of the deluxe resorts: “The first bus was “full” when I arrived so I was told to wait til the next bus… 15 minutes pass, bus 2 arrives, I get loaded. We’re waiting for the scheduled departure time when alarms go off on the bus. After 5 minutes the driver informs us they are sending another bus for us. That bus arrives, everyone exits and heads to the new bus. Before I’m unloaded, that bus left. So I have to wait for the next bus. It took me over an hour and 10 minutes to get back to the Poly.” Another user shared that “while the new buses can take 3 scooters they can only take 1 wheelchair”, and that there were issues with communication of expectations for the party members without mobility devices they were traveling with about boarding procedures, with different bus drivers doing things differently.

2 thoughts on “Four Months of “New DAS””